- Armor Blog
- Industry
- Interesting Figures and Facts About Automobile Usage

Global Automobile Usage
Few inventions have had the impact on our lives and the world around us as the automobile. Whether you drive a car, truck, minivan, or something else, the ability to go where you want, when you want, without the need for a horse or other animal to bear a load and to do so quickly and in relative comfort is truly amazing. As you might imagine, there are also some very interesting facts and figures surrounding the adoption, purchase, and use of automobiles around the world.
Number Purchased Per Year
Recently, the number of new vehicles purchased per year has declined. It is projected to hit 78.7 million in 2019, which is the same number as 2018. In 2017, however, 79 million units were sold. That marked an uptick from 2016, in which 77.3 million units were sold globally. It should be noted that these numbers are a major increase over previous years. For instance, from 2000 to 2015, only 54.9 million units were sold. From 1990 to 1999, only 39.2 million units were sold.
Leading Car Makers
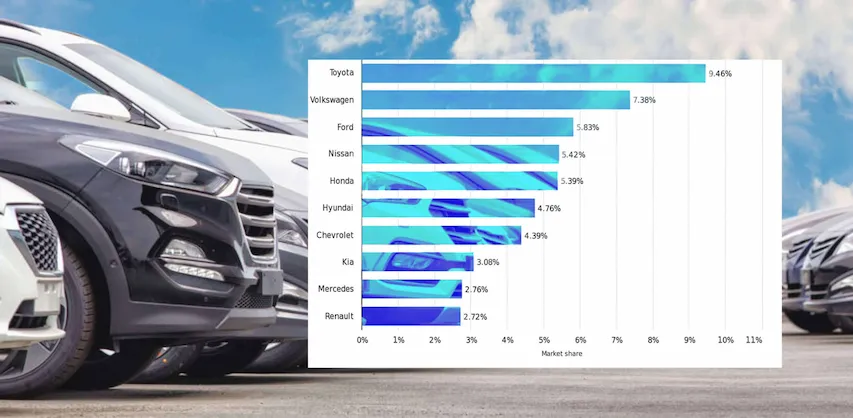
While the most visible automobile brands vary greatly from one country to another, if you take a look at the global auto market, there are some definite leaders, and some who are obviously lower down the list. For 2018, the most recent year for which information is available, Toyota led the pack with 9.46% of the global market share (in revenue). Volkswagen came in second with 7.38%, Ford was third with 5.83%, Nissan was fourth with 5.42%. In descending order, the rest of the global top 10 were:
- Honda
- Hyundai
- Chevrolet
- Kia
- Mercedes
- Renault
Brand Value
If you take a look at the global automotive market with an eye toward brand value, rather than market share and revenue, you get a slightly different picture. The top 10 valuable auto brands in the world in 2019 are as follows:
- Toyota
- Mercedes-Benz
- BMW
- Honda
- Ford
- Nissan
- Tesla
- Audi
- Volkswagen
- Porsche
For a complete list of all car brands and car manufacturers sorted by number, View here.
It’s interesting to note that while Toyota is at the top of both brand value and market share lists, the rest vary a great deal, with some brands maintaining very high values even without ranking in the top 10 for market share.
Lubrication And Fuel
Of course, the vast majority of those automobiles on the road today require both lubrication (engine oil), as well as fuel (gasoline, diesel fuel). In most instances, those are derived from petroleum, so tracking petroleum trends can help to shed light on important information. For instance, in 2018, the global production of oil was 94,718k barrels of oil per day. The global consumption of oil was 99,843k barrels per day, meaning that demand outstripped supply, keeping prices higher. For 2019, the forecasted demand is 100.8m barrels per day.
Conclusion
In conclusion, the global rise in automobile usage reveals the growing importance of quality vehicle care and maintenance products. As cars continue to evolve with latest technology, choosing the best products becomes essential for every driver. For reliable automotive lubricant solutions, explore our wide range of lubricants for automotive industry. Discover top products designed for performance, longevity, which meets and exceeds the international performance standards in the industry!


 Spear Lubricants
 Armada lubricant
 Ace lubricants
 Perfect lubricants
 Enzo lubricants
 Lawrence lubricants